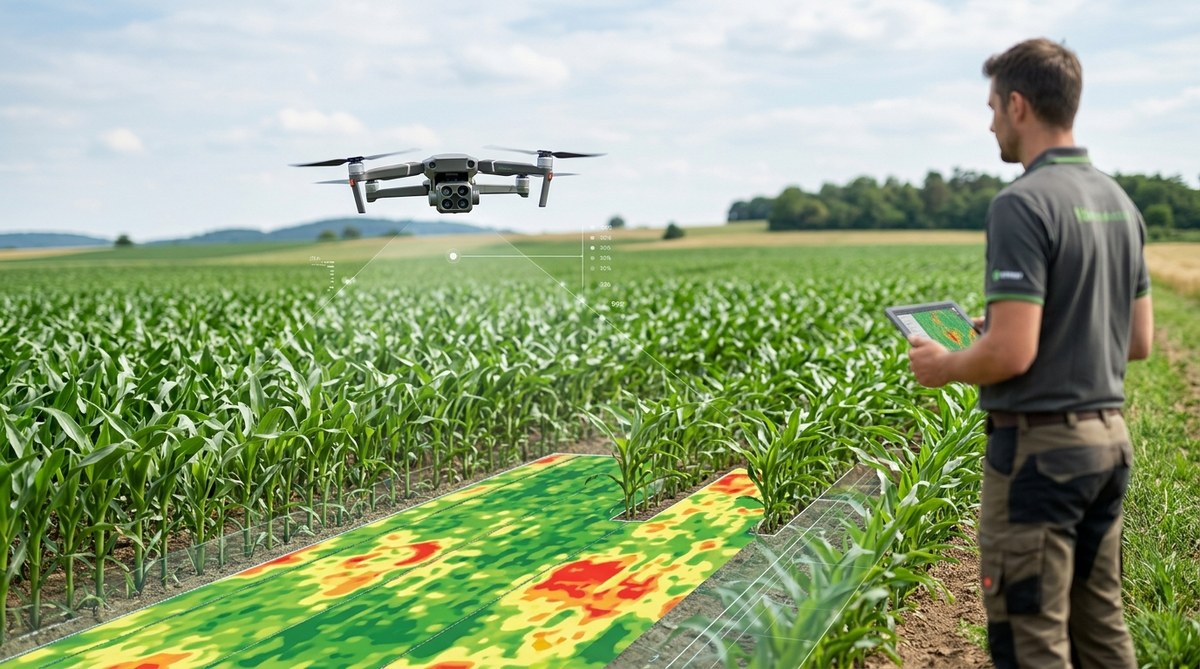
You are standing at the edge of a 200-acre cornfield in early July. The crop looks decent from the road, but you know some zones are underperforming. Maybe the leaves are a shade lighter than they should be. Maybe the stalks are shorter in the low spots. The question is: which nutrient is missing, and where exactly do you need to adjust your fertilizer plan?
Multispectral drone mapping gives you the answer without pulling a single soil core. By measuring how corn plants reflect light across specific wavelengths, you can pinpoint nitrogen, potassium, and zinc deficiencies before they slash your yield. This guide walks you through the entire process, from sensor selection to creating variable-rate application maps.
Multispectral drone mapping detects nutrient stress in corn by analyzing reflectance in the red-edge, near-infrared, and green bands. Nitrogen deficiency shows up as low NDVI with high green reflectance. Potassium deficiency appears in the red-edge zone. Zinc deficiency is visible through a drop in chlorophyll absorption. Pairing aerial imagery with ground truthing and soil sensor data turns those colored maps into actionable fertilizer prescriptions.
How Multispectral Sensors See What Your Eyes Miss
A standard RGB camera sees three bands of light: red, green, and blue. A multispectral sensor captures those plus the near-infrared (NIR) and red-edge bands. Healthy corn absorbs most red and blue light for photosynthesis and reflects strongly in NIR. When a plant is stressed by a nutrient shortage, its internal structure changes, and that reflectance pattern shifts.
The magic happens in the red-edge band, which sits between red and NIR at roughly 710 to 730 nanometers. This zone is extremely sensitive to chlorophyll content. When a corn plant is low on nitrogen, chlorophyll production drops, and the red-edge reflectance rises earlier than visible symptoms appear. That gives you a head start of seven to ten days over walking the field.
Choosing the Right Drone and Sensor Setup
Not all multispectral setups are equal. For corn nutrient work, you want a sensor with at least five bands: blue, green, red, red-edge, and NIR. The most common choices in 2026 are the Micasense RedEdge-P and the DJI P4 Multispectral. Both give you calibrated reflectance data, which is critical for comparing flights across the season.
Your drone needs to fly at a consistent altitude. For corn, aim for 120 to 200 feet above ground level. That gives you a ground sample distance of about 3 to 5 centimeters per pixel, which is fine enough to see individual rows but wide enough to cover 150 acres per battery cycle.
Step-by-Step Process for Detecting Nutrient Deficiencies
Here is the workflow we use on farms across the Midwest. Follow these steps to turn raw imagery into a prescription map.
-
Plan your flight window. Fly between 10:00 AM and 2:00 PM solar noon to minimize shadow variation. Overcast days are actually better than full sun because the lighting is more uniform. Avoid days with heavy wind over 15 mph.
-
Set up ground control points. Place five to ten reflective targets across the field. Survey their exact GPS coordinates. These points let you georeference the orthomosaic and validate reflectance values.
-
Fly the mission. Use a flight planning app like DJI Pilot or Pix4Dcapture. Set 80 percent front overlap and 70 percent side overlap. For a 160-acre field, expect about 25 minutes of flight time with a single battery.
-
Process the imagery. Stitch the individual images into an orthomosaic using photogrammetry software like Agisoft Metashape or Pix4Dfields. Generate the reflectance map for each band.
-
Calculate vegetation indices. The most useful indices for corn nutrient work are NDVI (normalized difference vegetation index), NDRE (normalized difference red-edge), and CCCI (chlorophyll content correlation index). NDRE is often better than NDVI for mid to late season corn because it saturates less at high biomass.
-
Create a zonal map. Divide the field into management zones based on index values. Zones with NDRE below 0.3 in early July are likely nitrogen stressed. Zones with NDRE above 0.5 are usually adequate.
-
Ground truth the anomalies. Take a handheld chlorophyll meter or leaf tissue sample from each zone. Compare the lab results to the index values. This step confirms which nutrient is actually deficient.
Reading the Signs: What Each Deficiency Looks Like in the Data
Different nutrient problems create different spectral fingerprints. Here is a breakdown of what to look for.
| Nutrient | Visible Symptom | Spectral Signature | Best Index |
|---|---|---|---|
| Nitrogen (N) | Pale green to yellow lower leaves | Low NDVI, high green reflectance, low NDRE | NDRE |
| Potassium (K) | Leaf tip burn, marginal scorch | Slight drop in red-edge, low water band index | Red-edge reflectance |
| Zinc (Zn) | Stunted growth, interveinal chlorosis | Low chlorophyll absorption in blue and red | CCCI or NDRE |
| Phosphorus (P) | Dark green or purple leaves | Low NIR, lower red reflectance | NDVI with red edge |
| Sulfur (S) | Uniform yellowing of new leaves | Similar to nitrogen but in upper canopy | NDRE |
The table above shows that nitrogen and sulfur can look similar in RGB images, but they separate in the spectral data because sulfur affects the upper canopy first while nitrogen hits the lower leaves. That is why you need the multispectral bands, not just a color camera.
Common Mistakes and How to Avoid Them
Even experienced operators make errors that turn good data into useless maps. Watch for these.
- Flying too high. Above 300 feet, you lose the resolution needed to see row level variation. Keep it under 200 feet.
- Ignoring calibration. Without a calibrated reflectance panel, your NDVI values drift between flights. You cannot compare a June flight to a July flight without proper calibration.
- Relying on NDVI alone. NDVI saturates in dense corn canopies. Switch to NDRE or CCCI after the V8 growth stage.
- Skipping ground truth. The drone tells you where the problem is, but only a tissue sample tells you which nutrient is deficient. Always validate.
- Flying at the wrong time of day. Early morning shadows create false low reflectance zones. Stick to the solar noon window.
Integrating Drone Data with Other Precision Tools
Multispectral mapping works best when you combine it with other data sources. Pair your flight results with implementing digital soil sensors to boost crop health and productivity so you can see if a low NDRE zone correlates with sandy soil or low organic matter. That connection tells you whether the deficiency is caused by a lack of nutrients in the soil or by poor root uptake due to compaction.
You can also feed the zonal maps into can variable rate technology significantly boost your corn yields to create prescription files for your fertilizer spreader. The drone map becomes the base layer, and the VRT system adjusts nitrogen rates on the fly as the applicator moves across the field.
For a broader view of how all these pieces fit together, read about harnessing iot devices to transform modern farming practices. The drone is just one node in a network that includes soil sensors, weather stations, and yield monitors.
Timing Your Flights Across the Season
One flight is not enough. To really dial in your nutrient management, plan a series of flights.
- Early season (V4 to V6). Fly at the four to six leaf stage. This is when nitrogen deficiency starts showing in the spectral data. If you catch it here, you can sidedress nitrogen before the plant enters its rapid growth phase.
- Mid season (V8 to V12). This is the most important flight window. The corn canopy is closing, and NDRE gives you a clear picture of nitrogen status. Use this map to adjust your final nitrogen application.
- Late season (R1 to R3). Silking to early grain fill. At this point, potassium and zinc deficiencies become visible. Late season maps help you plan next year’s fertilizer program.
“The biggest mistake I see is growers flying once in August and expecting a full picture. You need the early season baseline to separate a chronic deficiency from a temporary stress event.” – Dr. Maria Santos, precision agronomist, Iowa State University Extension
Using Data Analytics to Refine Your Prescriptions
Raw maps are useful, but they become powerful when you run them through a data analytics platform. Services like Climate FieldView and Granular integrate drone imagery with yield history and soil test data to generate prescription zones automatically. The analytics layer removes the guesswork from setting threshold values.
For a deeper look at how to process this information, check out top strategies for using data analytics to maximize crop yields. The combination of aerial imagery and historical yield data is one of the most reliable ways to predict which areas of the field will respond to extra fertilizer.
Building a Long-Term Nutrient Management Plan
Multispectral mapping is not a one season fix. Build a library of flight data over three to five years. Compare the same management zones across seasons to see if the same areas consistently show stress. If zone 17 in the northwest corner is always low on nitrogen, that tells you the soil there has a structural issue, not just a seasonal shortage.
Use that long term data to maximize crop yields with precision fertilization techniques. A field that consistently shows zinc deficiency in the same zones might benefit from a one time soil amendment rather than annual foliar sprays. The drone data, tracked over time, reveals those patterns.
Taking Action After the Map Is Ready
You have the orthomosaic. You have the NDRE zones. Now what?
Print the map and walk the field with a soil probe and a chlorophyll meter. Collect samples from the low, medium, and high zones. Send them to a lab for tissue analysis. Compare the lab results to the spectral data. If the lab says zone 3 is low on potassium and the red-edge reflectance was elevated there, you have confirmed the signature. Next year, you can skip the tissue test in that zone and trust the drone data.
Apply fertilizer only where the map says it is needed. If you are using a variable rate spreader, upload the prescription file directly from your analytics software. If you are broadcasting, at least you know which parts of the field need the higher rate and which can get by with less.
The Real Value of Multispectral Mapping for Corn
The dollar value comes from two places: reduced input costs and prevented yield loss. If you cut nitrogen use by 15 percent on the high residue zones and increase it by 10 percent on the sandy knolls, your total nitrogen bill might stay the same, but the yield distribution across the field becomes more uniform. That uniformity is what pushes your field average up.
A 2025 study from the University of Nebraska found that fields managed with multispectral drone mapping and variable rate nitrogen application averaged 12 bushels per acre more than fields managed with a flat rate. At $5.50 per bushel, that is $66 per acre in additional revenue, minus the cost of the drone service.
Your Next Flight
If you have not flown a multispectral mission yet, start with a single field. Pick one that has a history of uneven growth. Fly it at V8, process the data, and ground truth the zones. That one field will teach you more about your soil variability than a decade of soil sampling.
For more details on building a complete system around your drone data, read 7 steps to building a fully integrated smart farm system. The drone is the eye in the sky, but it works best when it talks to the sensors in the soil and the controller on the spreader.
The technology is mature in 2026. The sensors are affordable. The software is user friendly. What is left is the willingness to trust the data and act on it. Fly the mission, read the map, and adjust your fertilizer plan. Your corn will show you the results by harvest.
