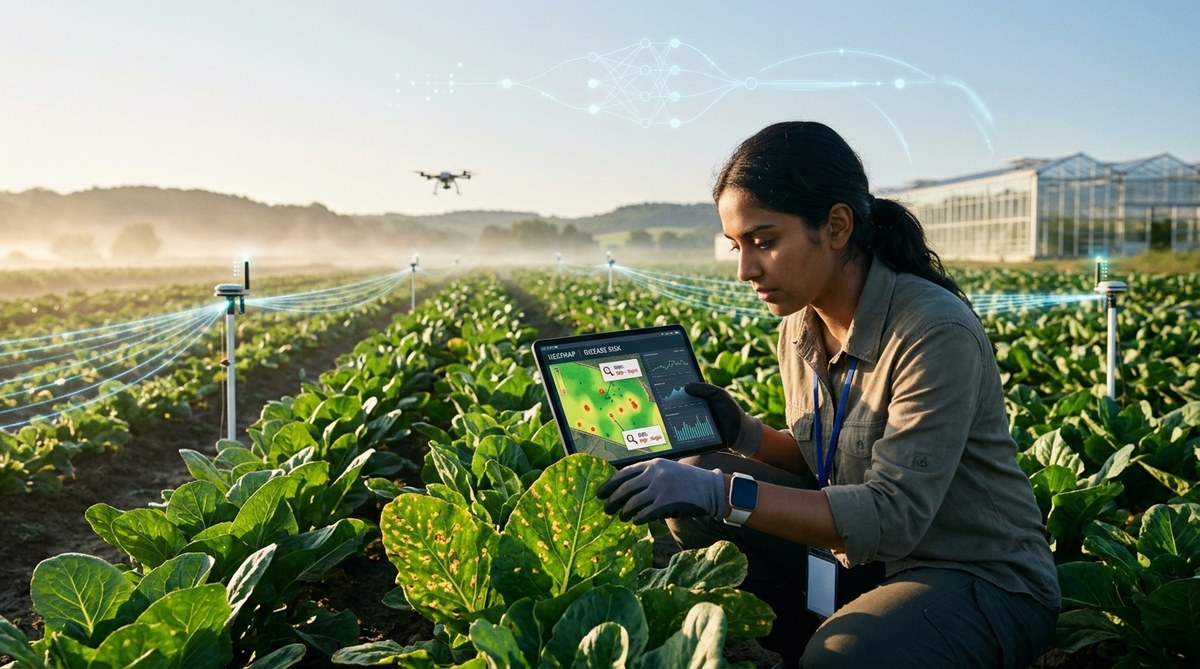
Every growing season brings the same silent race. You walk your fields, scan the leaves, and hope you catch the signs before it is too late. A few spots here, a bit of yellowing there. By the time you see the damage, the pathogen may have already moved to the next row. That is the old way. In 2026, we have a better tool for that race: machine learning.
Machine learning does not replace your experience. It extends your eyes and your memory. It processes thousands of data points from your fields, compares them to known disease patterns, and flags trouble before your unaided eye can spot it. This article walks you through the practical steps to use machine learning to predict crop diseases, keep your plants healthier, and protect your bottom line.
Machine learning predicts crop diseases by analyzing sensor data, weather patterns, and field images in real time. You need clean data, a trained model, and a feedback loop to improve accuracy. Start with one disease and one field. Use free or low cost tools. Pair predictions with scouting to confirm. This method cuts losses, reduces fungicide use, and builds a smarter farm system.
How Machine Learning Spots Disease Before You Can
Machine learning models learn from past examples. You feed them images of healthy leaves and diseased leaves. The model finds patterns in color, texture, and shape that humans miss. Once trained, the model can scan new images from your field and flag anomalies.
The same logic applies to environmental data. Models can learn that a specific combination of temperature, humidity, and soil moisture usually leads to powdery mildew. When those conditions appear, the system sends you a warning. You can act before the first spot shows up.
This is not science fiction. It is already running on tractors, drones, and even smartphones. The key is knowing how to set it up for your specific crops and region.
The Practical Process to Predict Crop Diseases
Follow these steps to build a disease prediction system that works on your farm.
-
Pick one crop and one disease to start. Do not try to predict everything at once. If you grow corn, focus on northern corn leaf blight. If you grow wheat, start with rust. Narrow focus helps you train a more accurate model with less data.
-
Collect labeled training data. You need images or sensor readings that are clearly marked as “healthy” or “diseased.” Take photos of leaves at different stages of infection. Record weather data from the days before the disease appeared. The more examples you have, the better the model learns.
-
Choose a machine learning platform. You do not need to build a model from scratch. Use platforms like TensorFlow, PyTorch, or farm specific tools like FarmDog. Many offer pre trained models that you can fine tune with your own data.
-
Train the model on your data. Upload your images or sensor logs. The platform splits the data into training and testing sets. It runs the training process, adjusting internal weights until the model can tell healthy from diseased with high accuracy.
-
Test the model in the field. Run the model on new images or data it has never seen. Check its predictions against your own scouting. If it misses too many cases, add more examples to the training set and retrain.
-
Set up a real time monitoring pipeline. Connect your field sensors, drones, or smartphone cameras to the model. Automate the data flow so the model checks your fields daily. Set alerts for when the model predicts a disease outbreak.
-
Validate and improve continuously. No model is perfect on day one. Each season, add new data. Retrain the model. Track its accuracy and adjust your thresholds. Over time, it becomes a reliable partner in your operation.
Data Types That Feed Disease Prediction Models
Different data sources give the model different clues. Use a mix for the best results.
- Visible light images: Standard photos of leaves and stems. Look for discoloration, spots, and wilting.
- Multispectral and thermal images: Captured by drones or satellites. They reveal stress invisible to the naked eye, like changes in water content or chlorophyll.
- Weather station data: Temperature, humidity, rainfall, and wind speed. Many diseases thrive in specific weather windows.
- Soil sensor readings: Moisture levels, pH, and nutrient content. Soil conditions affect plant immunity.
- Historical yield maps: Past outbreaks help the model learn which parts of a field are most vulnerable.
Combining these data types gives a fuller picture. For example, a model that sees high humidity plus low soil nitrogen plus a specific leaf color pattern is much more confident in its prediction than one using images alone.
Common Mistakes and How to Avoid Them
Even smart tools fail when used poorly. Here are the most common errors and the fixes.
| Mistake | Why It Happens | How to Fix It |
|---|---|---|
| Training on too few images | The model memorizes instead of learns | Collect at least 500 images per class (healthy and diseased) |
| Using only one data source | The model misses key environmental triggers | Combine images with weather and soil data |
| Ignoring seasonal variation | A model trained in summer fails in spring | Add data from all growth stages and seasons |
| Not validating predictions | False alarms erode trust | Always confirm predictions with field scouting |
| Overfitting to one field | The model does not work on different soil types | Train on data from multiple fields and regions |
Tools and Platforms That Make It Easy
You do not need a data science degree to get started. These tools are built for agronomists and farmers.
- FarmDog: Offers integrated data collection, model training, and field alerts. Built specifically for crop disease prediction.
- PlantVillage: A free platform with a large library of labeled crop disease images. Use it to train your own models.
- DroneDeploy: Captures aerial images and runs machine learning analysis on the fly.
- TensorFlow Lite: Runs models on a smartphone. Take a photo in the field and get an instant prediction.
“The best model is the one you actually use. Start small, validate often, and let the data guide your next step.” Dr. Maria Santos, precision agriculture researcher at Iowa State University
Building a Feedback Loop for Continuous Improvement
Machine learning is not a set it and forget it tool. Your fields change. New pathogens appear. Weather patterns shift. Your model needs to adapt.
Create a simple feedback loop. Every time you scout a field, log what you find. Compare it to what the model predicted. If the model was wrong, add that data point to the training set. Retrain the model after each season.
This loop turns your farm into a learning system. Each year, the predictions get sharper. You waste less time on false alarms. You catch real outbreaks earlier. Over five years, the difference in crop loss and input costs is dramatic.
To make this loop efficient, integrate your scouting data with your machine learning platform automatically. Many modern tools sync with your phone or tablet. You can tag a photo as “confirmed rust” right in the field, and that image goes straight into the training pipeline.
Why 2026 Is the Year to Start
The technology has matured. Cloud computing costs have dropped. Drone and sensor prices are lower than ever. And the data standards in agriculture are finally consistent enough to make machine learning work across different farms.
If you wait, you lose another season to preventable disease. The farms that adopt these tools now will have a multi year data advantage. Their models will be more accurate. Their fields will be healthier. Their input costs will be lower.
Your First Step Toward Smarter Disease Management
You do not need to build a system from scratch. Start with a single field and a single disease. Pick up your phone and take 50 photos of healthy leaves. Take 50 photos of leaves showing early symptoms. Upload them to a free platform like PlantVillage or FarmDog. Train a basic model. Test it on the next 20 leaves you find.
That small test will teach you more than reading a hundred articles. You will see the power of machine learning to predict crop diseases with your own eyes. And you will be ready to scale it across your entire operation next season.
The fields are waiting. Your data is already there. It is time to let the machines help you see what is coming.
