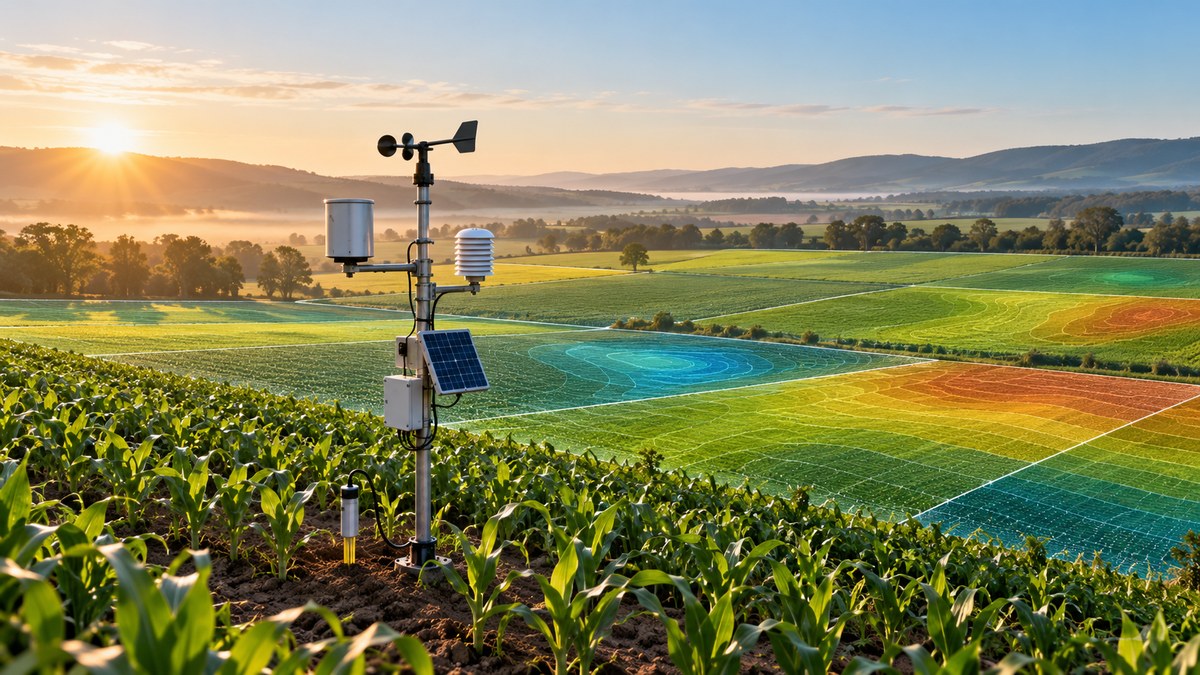
You are standing in a cornfield in central Iowa in late July. The sky is clear to the east, but a bank of clouds is building to the west. Your phone buzzes with a national weather alert warning of thunderstorms. But your field-level micro-climate station tells a different story: humidity is dropping, wind is shifting north, and soil moisture at the root zone is actually below the wilting point. The national forecast would have told you to pause irrigation. The hyper-local data tells you to run the pivot one more pass before the rain misses you entirely. That is the difference between guessing and knowing.
Micro-climate stations for agriculture are no longer a luxury for research farms. In 2026, they are the backbone of per-acre decision making. By combining local temperature, humidity, wind, solar radiation, and soil moisture data, these stations let you treat each management zone as its own farm. The result is tighter input control, fewer weather surprises, and yields that reflect what your ground can actually do.
Why a Single Weather Report Is Not Enough
Most growers still rely on a regional weather station from the nearest airport or a county seat. That data might be twenty miles away. In flat ground, a twenty-mile gap can mean a two-degree temperature difference and a completely different rainfall total. In rolling terrain, the variation is even larger. A hillside that faces south gets more solar radiation than a north-facing slope just a quarter mile away. A low-lying field holds cooler air at night, raising frost risk long after the airport says it is safe.
Micro-climate stations solve this by putting a sensor package right where your crop is growing. They measure conditions at the canopy level, not at a weather shack on a runway. For a precision agronomist managing thousands of acres, the difference between a regional forecast and a field-level reading can be the difference between a timely fungicide application and a missed window that costs you bushels.
What a Modern Micro-Climate Station Actually Measures
The stations available in 2026 are smaller, cheaper, and more rugged than ever. A typical unit includes these core sensors:
- Air temperature and relative humidity at canopy height
- Wind speed and direction (critical for drift management during spraying)
- Solar radiation (photosynthetically active radiation, or PAR, for growth modeling)
- Barometric pressure (helps predict short-term weather shifts)
- Rain gauge (tipping bucket or acoustic)
- Soil moisture and temperature at two or three depths
- Leaf wetness (the single most important variable for disease modeling)
Some premium stations add a soil electrical conductivity sensor or a carbon dioxide sensor for greenhouse operations. The data flows wirelessly to a cloud dashboard, often using LoRaWAN or cellular IoT networks. You can check conditions from your phone while you are in the combine or at the kitchen table.
How to Use Micro-Climate Stations for Per-Acre Decisions
Here is a practical process that works across corn, soybeans, wheat, cotton, and specialty crops.
-
Zone your fields by topography and soil type. Place at least one station in each major management zone. A 1,200-acre farm with three distinct soil series and significant elevation change might need four to six stations. Start with the zones that historically cause the most headaches: frost pockets, drought-prone ridges, and poorly drained bottoms.
-
Set threshold-based alerts. Configure your dashboard to notify you when conditions cross action thresholds. For example, a leaf wetness duration of six hours with temperatures between 60 and 80 degrees Fahrenheit triggers a fungicide advisory for gray leaf spot in corn. You get the alert on your phone before the disease gets a foothold.
-
Calibrate your models with local data. Most crop models and degree-day calculators are built on generic weather inputs. Feed your station data into your decision support system to recalculate growing degree days, evapotranspiration, and pest emergence dates. The numbers will shift, sometimes by several days, compared to the regional station.
-
Validate variable rate prescriptions. If you use variable rate seeding, fertilizer, or irrigation, the station data gives you ground truth for your prescription maps. You can see whether a zone that received a higher seeding rate actually experienced the growing conditions you assumed when you built the map.
-
Review and adjust seasonally. At the end of the season, pull the station data alongside your yield map. Look for correlations between micro-climate events and yield variability. That knowledge feeds directly into next year’s plan.
Common Mistakes When Deploying Micro-Climate Stations
Even good hardware fails to deliver value if it is installed or managed poorly. Avoid these errors.
| Mistake | Why It Hurts | How to Fix It |
|---|---|---|
| Placing the station next to a building or treeline | Wind readings are blocked; temperature is skewed by radiated heat | Install in the open field, at least 100 feet from any obstruction |
| Mounting the sensors too high | Data reflects conditions above the crop, not at the canopy | Set the sensor boom at canopy height; adjust as the crop grows |
| Ignoring sensor maintenance | Spider webs, bird droppings, and dust degrade accuracy | Clean sensors monthly; replace batteries or solar panels as needed |
| Relying on a single station for a diverse farm | One station cannot represent different slopes, soils, and aspects | Deploy one station per major management zone |
| Not integrating data with your farm management software | Data sits in a silo and never influences a decision | Use a platform that feeds station data directly into your agronomic models |
As one veteran agronomist put it:
“I used to carry a handheld weather meter and walk fields every morning. Now I look at my dashboard and know exactly which fields are wet enough to spray and which ones need another day. The station does not replace walking fields. It tells me where to walk first.”
Matching Station Density to Farm Complexity
Not every farm needs a station every 40 acres. The right density depends on three factors: topographic variability, crop diversity, and the value of the crop per acre.
For a 5,000-acre corn and soybean farm in flat central Illinois, one station per 500 acres might be enough. The terrain is uniform, and the crop mix is simple. For a 500-acre vegetable farm in California’s Central Valley, you might need a station every 40 acres. The crop value is high, the irrigation schedule is critical, and the micro-climate shifts between fields planted on different days.
A good rule of thumb: start with one station per 200 acres in the first year. After one season, you will know where the gaps are. Add stations in the zones that consistently surprise you.
The 2026 Technology That Makes Stations More Useful
Three technology trends are making micro-climate stations more powerful this year.
Edge computing on the sensor. Some stations now process data locally and only send alerts or summaries to the cloud. This saves battery life and lets the station make autonomous decisions, like closing a vent in a high tunnel when the wind exceeds a threshold.
Integration with satellite imagery. Station data is being fused with satellite-derived NDVI and soil moisture estimates. The ground-level station calibrates the satellite data, making the satellite maps more accurate. This combination gives you both broad coverage and precise local measurements.
Predictive models that learn from your fields. Instead of using generic disease or insect models, newer platforms let you train a model on your station data and your historical yield and pest records. The model learns how your specific micro-climate drives outcomes on your farm. This is a far cry from the one-size-fits-all models of five years ago.
If you are already using other precision tools, adding a micro-climate station network fills a critical gap. For example, if you are harnessing IoT devices to transform modern farming practices, the station becomes the weather node in your sensor mesh. Similarly, top strategies for using data analytics to maximize crop yields depend on high-quality input data, and nothing improves input quality like a station sitting in the field.
What the Data Looks Like After One Season
After a full growing season with micro-climate stations, you will have a dataset that reveals patterns you never saw before. You might discover that your north 80 consistently runs two degrees cooler than the rest of the farm during grain fill, costing you five bushels per acre. You might see that the southwest corner dries out three days faster after a rain, meaning you could be planting that ground earlier in the spring.
That knowledge changes how you manage each zone. You might switch to a shorter-season hybrid on the north 80. You might install tile drainage only in the slow-drying areas. You might adjust your nitrogen timing to match the actual moisture patterns.
The table below shows a simplified example of how station data can change a single decision: fungicide timing for frogeye leaf spot in soybeans.
| Zone | Leaf Wetness Hours (June 10-12) | Average Temp | Fungicide Decision (Regional Forecast) | Fungicide Decision (Station Data) |
|---|---|---|---|---|
| Ridge | 8 hours | 74°F | Apply June 13 | Apply June 13 |
| Slope | 14 hours | 71°F | Apply June 13 | Apply June 12 (one day earlier) |
| Bottom | 22 hours | 68°F | Apply June 13 | Apply June 11 (two days earlier) |
The regional forecast would have had you spray everything on the same day. The station data showed that the bottom needed treatment two days sooner. Those two days can mean the difference between a clean canopy and a field with significant disease pressure at harvest.
Building a Network That Pays for Itself
A single station costs between $400 and $1,200, depending on sensor count and connectivity. A network of six stations runs $3,000 to $7,000. That sounds like a real investment, but it pays back in the first season if it saves you from one bad decision.
Consider a 2,000-acre corn operation. If the station network helps you time a single fungicide application correctly on 500 acres that would otherwise have been sprayed too late, and that application saves you 10 bushels per acre at $4.50 corn, the value is $22,500. That is several times the cost of the network. The same logic applies to irrigation scheduling, nitrogen sidedressing, and harvest timing.
For operations that are already using variable rate technology, the stations provide the weather data needed to make variable rate irrigation truly effective. Can variable rate technology significantly boost your corn yields? The answer is yes, but only if you have the right input data. Micro-climate stations are that data source.
Where to Start Tomorrow
If you are ready to bring micro-climate stations onto your farm, here is a simple action plan.
- Pick two fields that are different from each other. One should be your best ground, one your most challenging. Install a station in each.
- Run them for one full season. Do not make any major changes yet. Just watch the data and learn what it tells you.
- Compare the station data to your regional weather source. Note the differences in rainfall totals, temperature extremes, and leaf wetness hours.
- At the end of the season, overlay the station data on your yield map. Look for correlations. That will tell you where to add stations next year.
- Expand your network based on what you learned. Add stations to the zones that showed the most variability.
You do not need to cover every acre on day one. Start small, learn, and scale.
Micro-Climate Data Is the Foundation for Smarter Farming
The biggest shift in precision agriculture over the past decade has been the move from field-level averages to zone-level specifics. Micro-climate stations are a natural extension of that trend. They take the guesswork out of weather-dependent decisions and give you data that is truly local.
Every farm has micro-climates. The question is whether you are managing them intentionally or letting them surprise you. In 2026, the tools to close that gap are affordable, reliable, and easier to integrate than ever. The growers who adopt them will make fewer mistakes, waste fewer inputs, and harvest more of what they grow.
Start with one station. Watch what it teaches you. Then build from there. Your fields will tell you exactly what they need, if you are listening with the right ears.
