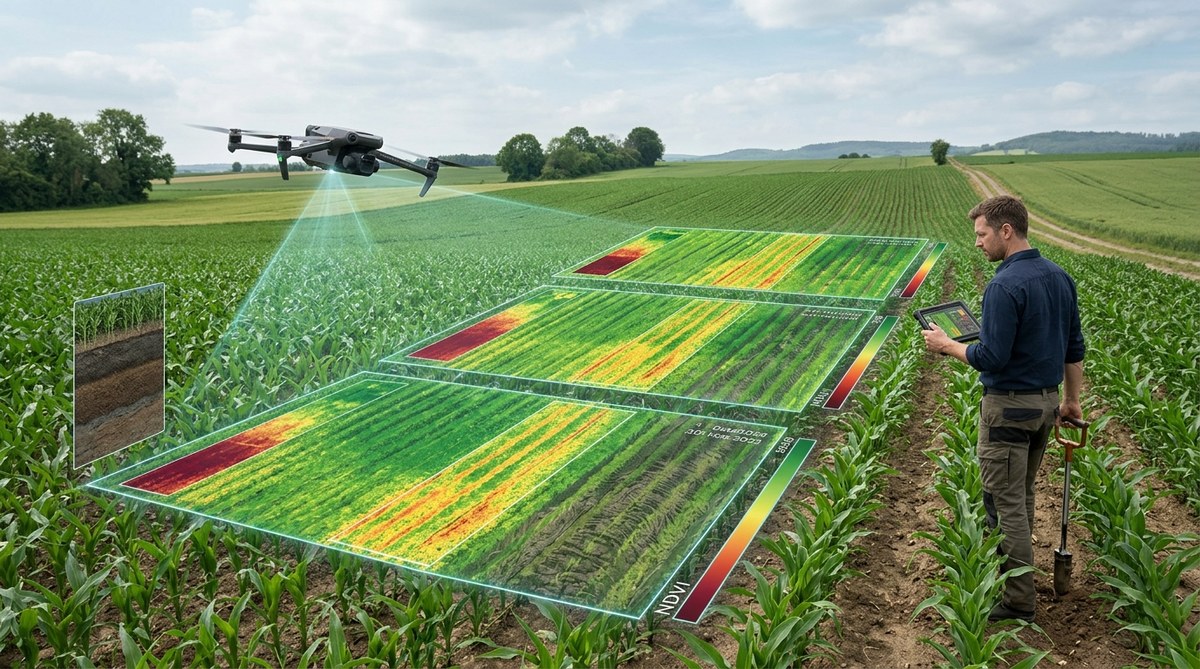
You walk a field in early July. The corn looks uniform from the road. But when you pull up your satellite imagery, you notice a faint, repeating pattern of lighter green stripes that mirrors your planter passes from three seasons ago. That pattern is not a nutrient issue. It is not a pest problem. It is soil compaction hiding in plain sight.
Standard soil sampling might miss these subtle zones. A single penetrometer reading can only tell you about one spot. But NDVI time-lapse analysis catches the story of the entire growing season. By stacking weeks of satellite data, you can see where roots struggled to push through compacted layers. The plants tell you everything if you know how to listen.
NDVI time-lapse analysis turns a stack of satellite images into a powerful soil compaction map. By comparing how the crop canopy changes over time, you can identify zones where roots cannot penetrate dense soil layers. This method works earlier than visual scouting and costs less than intensive grid sampling. In 2026, precision ag specialists use it to plan targeted tillage, variable-rate seeding, and drainage improvements.
Why Compaction Stays Hidden Until It Costs You Yield
Soil compaction is a silent thief. It reduces pore space, limits water infiltration, and stops roots from reaching nutrients deeper in the profile. The damage compounds over years. A compacted layer at 8 to 12 inches can cut corn yields by 15 to 25 bushels per acre in a dry year. Yet most growers do not find it until they dig a hole or watch a yield monitor drop in the fall.
The problem is that compaction does not look dramatic from the cab of a tractor. A field with moderate compaction may show only a slight height difference in the crop. By the time you see stunted plants, the yield loss has already happened. NDVI time-lapse analysis catches these zones when the plants are still green but growing slower than their neighbors.
How NDVI Time-Lapse Analysis Works for Compaction Detection
NDVI measures the greenness and photosynthetic activity of the crop canopy. A healthy, well-watered plant with deep roots reflects more near-infrared light and shows a high NDVI value. A plant struggling with compaction reflects less. The trick is that a single snapshot can be misleading. A compaction zone might look fine after a rain when the topsoil is moist. But when you look at the rate of change over time, the story becomes clear.
The Three-Step Process
-
Collect a time series of NDVI images from satellite or drone sources. Aim for at least six to eight images across the growing season. Capture one image during early vegetative growth, one at peak canopy, and one during grain fill. The more images you stack, the clearer the compaction patterns become.
-
Calculate the rate of NDVI change between each image pair. Compaction zones show a slower green-up in the spring and a faster senescence (browning) in the late summer. This creates a distinct signature. Normal areas show steady, vigorous growth. Compacted areas lag behind and then fall off sooner.
-
Overlay the rate-of-change map with your field operation history. Look for alignment with planter passes, sprayer tracks, or harvest traffic from wet years. If the slow-growth zones match your wheel tracks from two years ago, you have found compaction.
What to Look for in the Time-Lapse Animation
- Stripes that follow equipment patterns. These are the most common indicator of surface and shallow compaction.
- Irregular patches near field entrances or headlands. Turning heavy equipment on wet soil creates deep compaction that persists for years.
- Circular or oval zones that do not match soil type boundaries. These often indicate old manure or fertilizer spills that altered soil structure, but they can also hide compaction from temporary grain piles.
- Areas that show a consistent 10 to 20 percent NDVI deficit across all growth stages. This suggests a root-limiting layer that never resolves.
Common Mistakes in NDVI Compaction Analysis
Even experienced agronomists can misinterpret NDVI time-lapse data. The table below outlines the most frequent errors and how to avoid them.
| Mistake | Why It Happens | How to Fix It |
|---|---|---|
| Using only one or two images per season | A single snapshot cannot show growth rate. Compaction looks similar to drought stress in a single image. | Collect at least six images across the season. Use a platform that auto-stacks satellite data. |
| Ignoring weather patterns | A dry year makes compaction look worse. A wet year masks it. You need multiple seasons to confirm. | Compare three to five years of time-lapse data. Persistent patterns are compaction. |
| Confusing compaction with soil type | Sandy soils naturally have lower NDVI. You might mistake a sand ridge for a compaction zone. | Overlay a soil type map. Subtract the baseline NDVI for each soil type before looking for anomalies. |
| Analyzing only the peak NDVI value | Peak NDVI can be high even in compacted areas if the crop compensates with tillering. | Focus on the rate of change, not the peak value. Compaction shows up in the slope of the curve. |
| Forgetting about drainage | Wet spots look like compaction in NDVI. Standing water kills roots. | Cross-reference with a drainage map or a wetness index. If the zone is also wet, drainage is the primary issue. |
A Practical Scanning Routine for Your Fields
When you sit down with your time-lapse data, use this checklist to scan for compaction signatures.
- Check the early season images first. Compaction shows up earliest in the spring when roots hit the hard layer.
- Look for linear patterns. Straight lines that match your planter width or sprayer boom width are almost always traffic compaction.
- Compare the timing of stress. Does the zone turn yellow earlier than surrounding areas? That is a classic compaction signal.
- Note the shape of the boundary. Sharp edges suggest a mechanical cause. Fuzzy edges suggest a soil or nutrient cause.
- Overlay your yield map. If the low-yield zones match the slow NDVI zones, you have confirmed the problem.
“I used to think compaction was only a problem in wet years. Then I stacked three years of NDVI data and saw the same stripes show up every single season, even in dry years. The yield loss was there all along. I just was not looking at the right time scale.” — Ryan K., precision ag specialist in central Illinois
Building a Multi-Year Compaction History
One season of NDVI time-lapse data is useful. Three seasons is diagnostic. Compaction patterns that persist across different weather years are almost certainly physical soil limitations, not seasonal stress. Here is how to build that history.
Start by choosing a consistent image source. Satellite data from Sentinel-2 or Landsat works well because the historical archive goes back years. If you have drone imagery from previous seasons, you can integrate it, but be careful about differences in resolution and calibration.
Create a baseline map for each field. This is the average NDVI value for every pixel across all the years you have. Then subtract that baseline from each individual year. The residual map shows where the crop performed worse than normal. If a zone shows negative residuals in three out of five years, that is a compaction candidate worth ground-truthing.
Ground-Truthing Your Findings
NDVI time-lapse analysis tells you where to look, but it does not replace a soil probe. Once you have identified suspect zones, go into the field with a penetrometer or a tile probe. Check the depth of the compacted layer. Measure it at multiple points across the zone boundary. You will often find that the hard layer is exactly at the depth of your tillage equipment or your tire tracks.
If the compaction is shallow (less than 6 inches), a targeted pass with a shallow ripper or an aerator may solve it. If it is deeper, you might need deep ripping or cover crops with strong taproots. For severe cases, consider variable-rate seeding to reduce plant population in the compacted zone and avoid wasting seed.
Integrating This Method into Your 2026 Workflow
The tools for NDVI time-lapse analysis are more accessible than ever. Platforms like FarmDog aggregate satellite imagery and calculate vegetation indices automatically. You do not need to download and stack images manually. The software handles the time series and highlights anomalies.
To get the most out of this method, pair it with other data sources. Soil sensor networks can confirm the compaction by measuring moisture variability across the field. Yield data from previous seasons provides the economic validation. When you show a grower that a compacted zone costs them 20 bushels per acre every year, the conversation shifts from “should we fix it?” to “which fix pays the best?”
For more on building a complete data ecosystem, read about harnessing IoT devices to transform modern farming practices. If you want to connect NDVI insights directly to input decisions, our guide on top strategies for using data analytics to maximize crop yields will help you close the loop.
Making Compaction Visible Starts with Time
The most powerful tool in your precision ag toolbox is not a sensor or a drone. It is time. NDVI time-lapse analysis lets you see how the crop responds to the soil across an entire season. Compaction zones tell their story slowly, week by week, as the roots struggle and the canopy fades. When you stack those weeks into a single view, the hidden patterns jump out.
Start this season. Pull your satellite data from the last three years. Build a time-lapse for your most challenging field. Look for the stripes and the slow zones. Then go dig a hole and see what you find. The yield you recover next year will be the best thank-you note you ever get from your soil.
