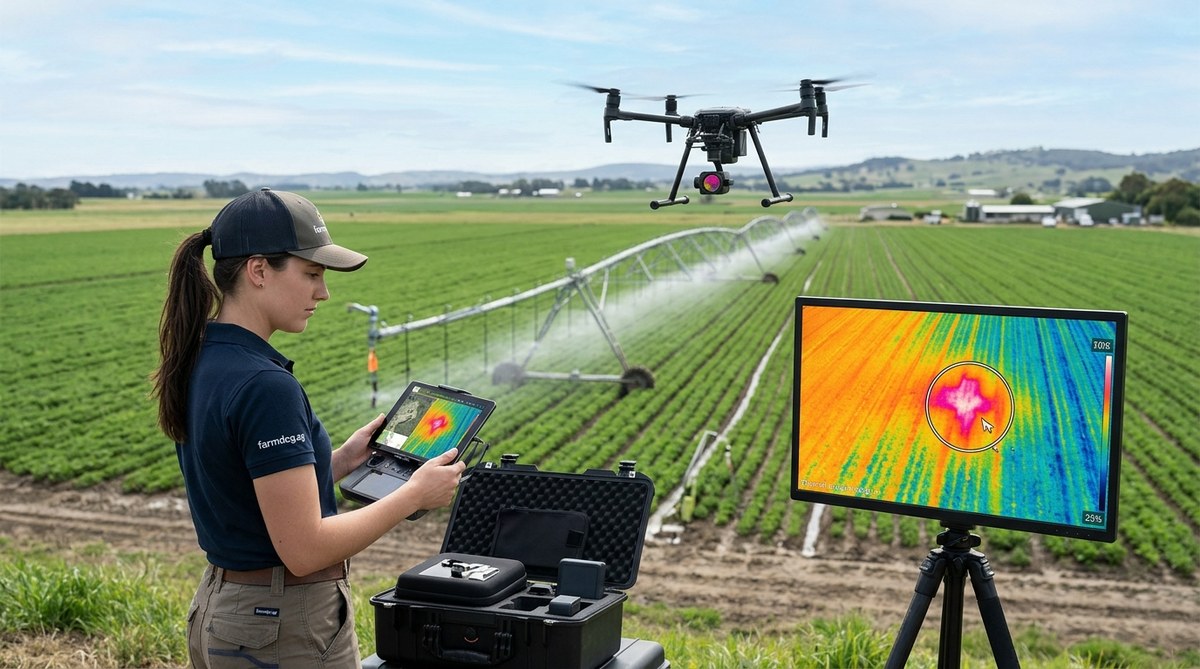
A hidden irrigation leak can waste hundreds of gallons of water a day. You might not see it from the ground. The soil surface can look dry while water pools deep underground or escapes through a cracked fitting. By the time you notice the soggy patch or the spike in your water bill, thousands of gallons have already vanished. That is where a thermal imaging drone changes everything.
Thermal imaging drone water leak detection works because escaping water is often cooler or warmer than the surrounding soil. A drone equipped with a thermal camera can scan hundreds of acres in under an hour, producing a temperature map that pinpoints leaks you cannot see from the ground. This method cuts water loss, lowers repair costs, and keeps your irrigation system running at peak efficiency.
Why Thermal Imaging Works for Irrigation Leaks
Water has a high specific heat capacity. That is a fancy way of saying it heats up and cools down slower than dry soil. When water leaks from a pipe or emitter, it changes the temperature of the ground around it. On a hot afternoon, a wet patch will stay cooler than the dry field. On a cool morning, that same wet patch may appear warmer because the water retains heat from the previous day.
A thermal camera mounted on a drone captures these temperature differences with high precision. The camera measures infrared radiation and turns it into a visual map. A trained operator can spot a blue or purple spot (cool leak) against a yellow or red background (dry soil) in seconds.
This method is especially valuable for:
- Large pivot irrigation systems where a leak at the far end of the arm can go unnoticed for weeks.
- Drip tape networks buried under mulch or crop residue.
- Underground mainlines that feed multiple zones.
- Old galvanized or PVC pipes that develop pinhole leaks over time.
How to Conduct a Thermal Drone Leak Survey
Getting useful data from a thermal drone flight is not complicated, but it does require some planning. Follow these steps to make sure your survey catches the leaks.
- Choose the right time of day. The best thermal contrast happens when the sun is high and the ground is warm. Fly between 11 a.m. and 3 p.m. on a clear day. Early morning flights can work if the dew has evaporated, but afternoon flights usually give the clearest temperature difference between wet and dry areas.
- Set your drone height and speed. Fly at 100 to 200 feet above ground level. This gives you a wide field of view while keeping enough resolution to see a leak the size of a dinner plate. Keep the drone speed under 15 mph so the thermal sensor can capture crisp images.
- Run the irrigation system before the flight. Turn on the water for 15 to 30 minutes before the drone takes off. This gives the leak enough time to create a visible temperature signature. For buried pipes, you may need to run the system for an hour.
- Fly a grid pattern. Use the drone’s autonomous flight mode to map the entire field in parallel rows. Overlap each pass by at least 30 percent. This ensures you do not miss a spot and makes it easier to stitch the images together later.
- Review the thermal data on site. Many drones let you view the thermal feed on a tablet in real time. If you spot a cold anomaly, mark the GPS coordinate and investigate it immediately. Some leaks are small and may not show up on the stitched map after the flight.
Common Mistakes in Thermal Leak Detection
Even with good equipment, you can miss leaks if you do not account for environmental factors. Here is a table that shows common mistakes and how to avoid them.
| Mistake | Why It Happens | How to Fix It |
|---|---|---|
| Flying too early in the day | Low thermal contrast between wet and dry soil | Fly between 11 a.m. and 3 p.m. when the ground is warmest |
| Not running water before the flight | No temperature difference yet | Run the irrigation system for at least 15 minutes before takeoff |
| Flying too high | Cannot see small leaks | Keep altitude between 100 and 200 feet |
| Ignoring shadows from trees or buildings | Shadows create false cold spots | Fly when shadows are minimal (around solar noon) |
| Using only one flight | Misses leaks that only appear under certain conditions | Repeat the survey after a dry spell and after a heavy rain |
What to Look for in the Thermal Image
When you look at the thermal feed or the stitched map, you are looking for anomalies. A healthy, dry field will show a fairly uniform temperature across the area. An irrigation leak will appear as a distinct cold spot (or warm spot depending on the time of day).
Look for these patterns:
- A small, round cold spot right at the base of an emitter or sprinkler head. This usually means a broken fitting.
- A linear cold streak running along the direction of a buried pipe. This indicates a crack or separation in the mainline.
- A large, diffuse cold area at the downhill end of a slope. This can mean a slow leak that has been running for days.
- Multiple cold spots clustered together. This may point to a pressure issue that is causing several emitters to fail at once.
“We flew a thermal drone over a 500-acre pivot farm in Nebraska last August. The farmer thought his system was running fine. The thermal map showed three cold spots along the mainline. We dug down and found two cracked joints and one fitting that had come loose. Fixing those three spots saved him an estimated 40,000 gallons a week.” — Mark R., precision agrologist
Integrating Thermal Data with Other Farm Tools
A thermal drone survey is most powerful when you combine it with other data sources. For example, you can overlay the thermal map on a soil moisture sensor grid to confirm that a cold spot is actually a leak and not just a naturally wet area. You can also import the GPS coordinates of each leak into your farm management software so your crew can find the exact location without guesswork.
If you are already using smart sensors to improve irrigation efficiency, adding thermal drone flights gives you a second layer of detection. The sensors tell you when the soil is too wet. The drone tells you where the leak is. Together, they close the loop.
For operations that rely on data analytics to maximize crop yields, thermal leak data is a natural addition to your existing dashboards. You can track leak frequency over time, identify problem zones, and make smarter decisions about pipe replacement schedules.
How Often Should You Survey
The frequency depends on your system age and water costs. For a new drip irrigation system with poly tubing, one survey per growing season may be enough. For an older system with metal pipes or underground mains, consider flying every two to three months during the irrigation season.
Some farms run a thermal survey right before harvest when water stress is most damaging. Others do a survey in early spring before the crop canopy fills in and hides the ground. The best schedule is the one that matches your risk level.
If water is expensive in your region or if you are under a conservation mandate, monthly flights are worth the investment. The cost of a thermal drone flight is often less than the cost of the water lost from a single undetected leak over a month.
Putting the Method to Work
Thermal imaging drone water leak detection is not a theoretical tool. It is a practical, field-tested method that saves water, money, and time. The technology has become more affordable in the last three years. A good thermal drone setup costs less than a new pivot end gun, and it can pay for itself in one season of leak repairs.
Start small. Pick one field that you suspect has a problem. Fly it during the warmest part of the day after running the water for 20 minutes. Look for the cold spots. If you find one, dig it up and fix it. Then calculate how much water you saved. That number will tell you whether to expand the program to the rest of your operation.
The water you save today is water you can use tomorrow. And with a thermal imaging drone in your tool kit, you will never have to wonder where your irrigation water is going again.
